The bull market in stocks celebrates its eighth birthday today. As it turns out, it's also my birthday. This got me thinking about what was happening in the world when I turned 8. In 1980, the Pac-Man arcade game was released. Camcorders and fax machines were cutting edge technology. A whole lot of people were watching TV to find out Who Shot JR? on the popular soap Dallas. The yearly inflation rate in the U.S. was 13.6%. The average cost of a new house was $68,700. The average cost of a new car was $13,650. I'll also mention that a (government subsidized) hot school lunch cost $0.65 and milk was $0.05. Okay, enough about me.
What It Means for the S&P
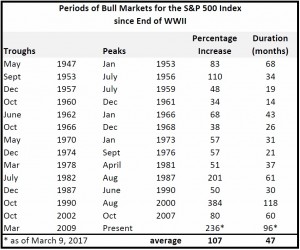
As far as bull markets go, since World War II, 8 years old is pretty old. By our measure, the average duration of a bull market is 47 months. The current bull market is 96 months old. That means that we have not experienced a decline of 20% or more in that time. The bull market is now the second oldest in the history of our matrix below.
Are We There Yet?
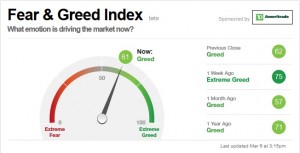
Many are wondering when the next bear market will hit. The anecdotal evidence says that most investors still want to own more stocks. CNN's Fear and Greed Index is currently at 61 signaling that investors are more greedy than fearful. Notably, the index is not at an extreme.
Carl Icahn, one of Trump's early supporters on Wall Street, recently said, “I am concerned at this point that the market has run ahead of itself.”
Sam Stovall, chief investment strategist at CFRA Research wrote in a report, “Bull markets don't die of old age, they die of fright. And what they are most afraid of is recession.”
Tracking Financial Weather Conditions
We agree that it is not the age of the bull market that matters but rather what is happening in the world in terms of monetary policy, economic and technical conditions, and overall valuation. These are the four major categories of variables that we have observed to heavily influence the trend and direction of the financial markets. In Monetary or M, there are twelve statistical series. We systematically measure Fed policy, banking liquidity, the cost of money and the supply and demand for credit. We gauge the liquidity in the banking system that will likely directly affect stock and bond prices. In the Economic or E which measures corporate profitability, there are sixteen series. Technical or T tracks market psychology with 10 indicators. In Value or V, we incorporate a comprehensive valuation methodology that includes price to earnings, price to book value, dividend discount model and yield analysis to quantify the market’s upside potential and downside risk.

As of this writing, we do not yet see any storm clouds on the horizon.
What are your thoughts on the current bull market turning 8? Are you bullish, bearish, or neutral?
Feature Image from GrokAI