The last couple of weeks have been dominated by two topics: Greece and China. Last week we tackled what a Greek default means to your investment portfolio. This week we give our insight on the Chinese market which has tumbled in the last month. At Runnymede, we want to give our readers a different perspective than the alarmist headlines from other news sources. Unfortunately with internet news, they are paid on clicks so it's reliant on attention grabbing headlines, not necessarily the reality. We don't simply rehash what the mainstream news reports on. We look deeper beneath the surface to help you make informed investment decisions.
Is China in a bubble?
There is no doubt that the last month has been a wicked downturn for the Chinese markets. The Shanghai Composite dropped over 30% in the last month. Taken at face value it sure looks like a bubble that burst. If you look at a one year view, from June 30th 2014 to June 12, 2015, the Shanghai Composite exploded higher to an increase of 150%! Incredible. Even with the recent fall, the index is still up 80% since June 30, 2014.
Rarely do you see a country's stock market rise with this magnitude in such a short period of time. Clearly there was a bit of euphoria in the Chinese market which is taking a healthy, yet violent correction.
Here is a 10 year chart of Shanghai. If you look at this chart, the recent rise and fall of the market is eerily reminiscent of 2007.
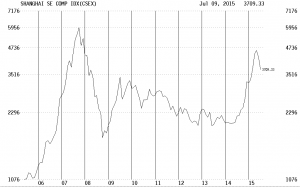
So how similar is the current Chinese market to 2000 or 2007? While the rise in price is sharply higher like 2007 or the US technology bubble of 2000, there is a huge underlying difference: valuation.
Chinese valuations are reasonable
Most investors still recall the euphoria of the high tech bubble of 2000. People bought stocks with no earnings and didn't really care either at least when the stocks were on the upswing. The Nasdaq Composite traded at a peak price to earnings (PE) multiple of 145x! That was pure insanity. Today the Nasdaq is much more reasonable at 24x trailing earnings.
Let's look at a chart of the PE of the Shanghai Composite:
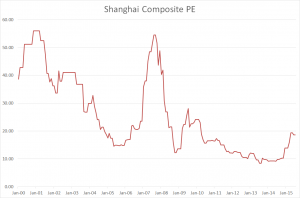
In 2007, the Shanghai Composite traded at a huge multiple of 55x trailing earnings. It was no surprise that the market fell in tandem with the US and it bottomed out at 12x in 2008. Considering that the Chinese economy was growing at almost 10% that was extraordinarily cheap in 2008.
After the huge run up over the last year, the Shanghai Composite still trades at a reasonable PE of 18x. While the Chinese economy has slowed to 7% GDP growth, the stock market seems to trade at a reasonable level. This definitely doesn't reflect a bubble of any kind. In comparison, the Nasdaq Composite trades at 24x and the S&P 500 trades at 18x. With US GDP growth of roughly 2%, the US is arguably less attractive on a relative basis.
If there is one area to steer clear of in the Chinese market, it is in small caps which do look to be in bubble territory. According to Brendan Ahern at Kraneshares, the ChiNext composite has skyrocketed way ahead of earnings to a peak multiple of 130x in early June (similar to the Nasdaq bubble levels). Today the Chinext still trades at over 80x PE.