When looking at the financial weather, Runnymede uses a multi-factor model to track where we are in the market cycle. One of the key components is valuation. Two of the most famous valuation models are Warren Buffett's total market capitalization to GDP and Nobel laureate Robert Shiller's CAPE (cyclically adjusted PE) ratio. If you look at either of these measures, the market is overvalued.
The Buffett Indicator
Back in 2001, Buffett remarked in a Fortune Magazine interview that Market Cap to GDP “is probably the best single measure of where valuations stand at any given moment.” This metric can be thought of as an economy wide price to sales ratio.
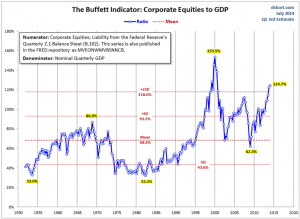
Using the Buffett indicator, the market looks to be trading at a very lofty valuation. Since 1950, the market has traded at a higher multiple just once which was the internet-bubble peak. Today we trade at a higher level than the 2007 housing-bubble peak and one wonders if this is another peak.
Shiller's CAPE ratio
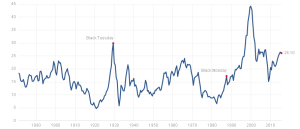
Robert Shiller, Yale professor and Nobel prize winner, is “definitely concerned” about the valuation of stocks which are trading at historic highs. Using his CAPE (cyclically adjusted price-to-earnings ratio) model, stocks are trading at 26x multiple which is well above its long-term average of 17. Shiller points out that the CAPE level has only been higher 3 previous times: 1929, 2000 and 2007. That sure sounds like a dire warning of a huge market drop. But is it?
“It looks to me like a peak,” says Shiller. “I would think there are people thinking ‘it's gone way up since 2009, it's likely to turn down again.' That's what people might plausibly think.”
Despite the CAPE trading at high levels, Shiller isn't actually advocating selling all your stocks because it could act like 2000 again. Shiller says, “Realistically, stocks should be in one's portfolio but maybe lighten up.” He believes that stocks should be in one's portfolio because interest rates are so low that the fixed income market isn't very attractive.
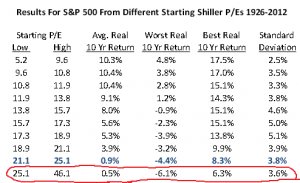
Shiller's CAPE ratio is currently above 26x. This doesn't bode well for future returns. Take a look at this chart:
Conclusion
Looking at these two valuation models together, the market certainly looks overvalued in relation to history. The next 10 years will likely be a challenging environment for investors and it isn't going to be an easy road to navigate. It most certainly won't be a good environment for those who choose to set it and forget it. There are times to be aggressive and times to be defensive. Simply using valuation metrics, this is a time to be defensive.